Research
Please note that the Weekly Investment Insights will be paused over Easter and will resume on the 28th of April.
Easter is just around the corner, but this year there may be fewer eggs hiding in the bushes during Easter egg hunts in the US. CPI figures last week showed that egg prices remain elevated following the avian flu outbreaks that sent egg prices soaring in the US earlier this year, prompting some consumers to turn to potatoes and other egg-shaped objects for their Easter traditions this year.
Tariff announcements continued to keep investors on their toes last week as President Trump’s trade tariffs went into place for a moment on Wednesday, only to be followed by the announcement of a 90-day pause on the 'reciprocal' tariffs on most countries, with the exception of China. The general 10% tariff on all US imports, as well as the 25% tariff on cars, steel and aluminium, were left in place. The tariff announcements from the US and China continued to escalate as China kept meeting the tariffs put in place by the US. By Friday, the tariffs announced on Chinese imports into the US were as high as 145%, and tariffs on US imports into China at 125%. Oil fell below $60 a barrel for the first time since 2021.
Treasuries sold off as the safe haven status of US sovereign debt was put in question by growing fears of a US recession. Gold experienced its best week in five years as investors looked for safety.
Equity markets started this week with a boost by the news that smartphones, laptops and other devices would be exempt from tariffs, despite US warnings that these exemptions would be temporary.
Weekly Highlights
US inflation rate fell to 2.4% in March
US inflation fell more than expected to 2.4% in March, which is the lowest level since September. Looking at the core, which strips out volatile categories, it fell to 2.8%, the lowest since March 2021, in what will be a welcome development for the Fed as it pursues its 2% inflation target, while increasingly being forced to consider prospects for weaker growth ahead.
Digging into the details, gasoline (-9.8% vs -3.1%) and fuel oil (-7.6% vs -5.1%) fell more while natural gas prices soared (9.4% vs 6%). Shelter inflation, which has proven extremely sticky, cooled slightly (4% vs 4.2%).

Source: Bloomberg, BIL
Inflation accelerated for food (3% vs 2.6%), with the CPI egg index rising 5.9% from February (or 60.4% on an annual basis). The US Department of Agriculture has indicated in recent postings that wholesale prices are starting to fall as the avian flu comes under control, but those declines aren’t yet visible in retail level data.
Compared to the previous month, the CPI decreased 0.1%, the first fall since May 2020, compared to expectations of a 0.1% gain. While encouraging, the shock from tariff hikes is not reflected yet.
Consumer sentiment in the US falls sharply in April
According to preliminary estimates, Michigan consumer sentiment dropped to 50.8 in April, its lowest level since June 2022, down from 57 in March and below expectations. Consumer sentiment fell for the fourth consecutive month amid growing concerns about a potential trade war. Expectations for business conditions, personal finances, incomes, inflation and the labour market all continued to deteriorate, showing warning signs of a risk of recession.
Notably, the gauge for expectations for economic conditions fell to 47.2, the lowest since May 1980. At the same time, inflation expectations for the year ahead surged to 6.7%, the highest reading since 1981.
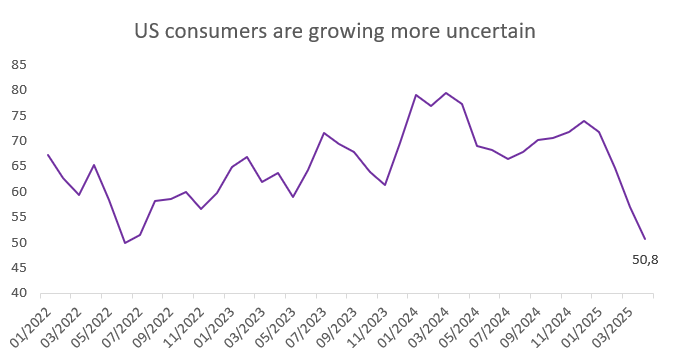
Source: Bloomberg, BIL
The uncertainty of the US trade policy continues to weigh down consumer sentiment, as consumers try to anticipate the potential impact the tariffs will have on them.
Cars pile up at US ports as carmakers halt shipments
Following the implementation of a 25% tariff on all cars imported into the US, thousands of vehicles are being held up at US ports as carmakers delay the entry of cars into the US to protect their businesses from President Trump's trade war. Hopes that the tariffs may yet be eased, and uncertainty over how they will be applied, have led foreign carmakers to halt shipments as they wait for more clarity.
The impact is not only being felt in US ports. European ports are also filling up with cars waiting to be shipped to the US. Whether or not the tariffs on imported cars could be eased, storing cars at ports is a temporary, expensive and limited solution, meaning that carmakers will soon have to make a decision about their US exports.
UK economy grew by 0.5% in February, beating expectations
After no growth in January, the UK economy grew by 0.5% month-on-month in February. Industrial production surged by 1.5%, rebounding from a 0.5% decline in January, driven mainly by a rise in manufacturing output.
This is the fastest monthly GDP growth rate since March 2024 but, while a promising sign, the figure predates President Trump's announcement of 'reciprocal' trade tariffs, including a 10% tariff on British goods imported into the US, which is expected to negatively impact growth going forward.
Ongoing uncertainty over trade tariffs is expected to dampen business sentiment and delay investment, weighing on growth over the coming months. This follows the increased taxes businesses are faced with as a result of the Autumn Budget, that came in effect this month.
Investors now expect the Bank of England (BoE) to cut interest rates in May to support the economy and offset some of the negative impact of the tariffs.
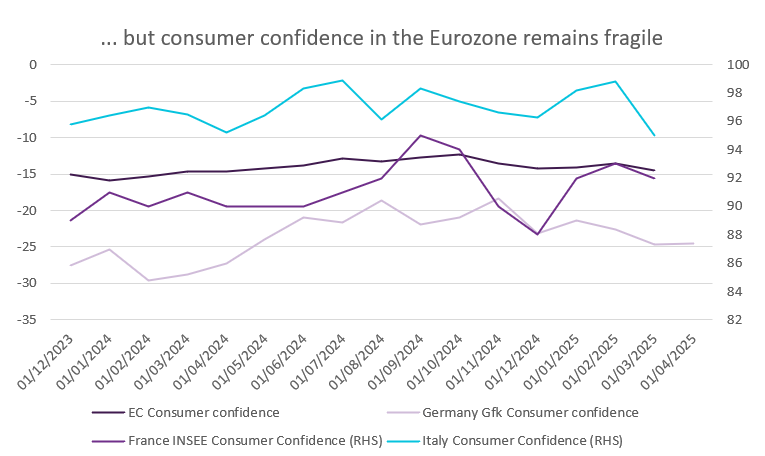
Eurozone Retail Sales edge up, but confidence remains fragile
Retail sales in the Eurozone saw an increase in February, marking the first rise since September. Whether the uptick can persist is uncertain, especially given new uncertainties in the global trade arena. Already, Eurozone consumer confidence fell in March, with consumers notably more pessimistic about the future economic situation in their respective countries.
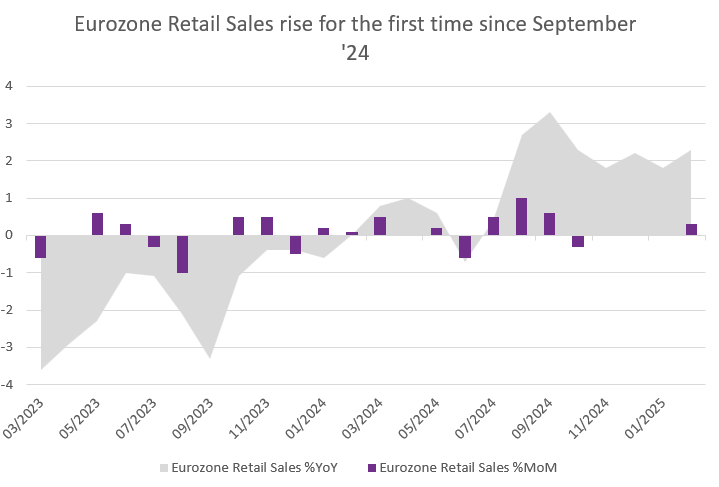
Source: Bloomberg, BIL
Zooming in on Germany, sentiment was little changed in the first take on confidence since the election. The subindex for economic prospects did rise from 1.2 to 6.9, however, the propensity to save reached its highest level since April 2024. A lot now depends on whether the recently adopted fiscal stimulus package is implemented swiftly and effectively.
Source: Bloomberg, BIL
Calendar for the week ahead
Monday – China Balance of Trade (March). US Consumer Inflation Expectations (March).
Tuesday – UK Unemployment Rate (February). Eurozone Industrial Production (February). Eurozone & Germany ZEW Economic Sentiment Index (April).
Wednesday – China GDP Growth Rate (Q1), Unemployment Rate (March). UK Inflation Rate (March). Eurozone Inflation Rate (Final, March). US Retail Sales (March), Industrial Production (March).
Thursday – Switzerland Balance of Trade (March). ECB Interest Rate Decision. US Housing Stats, Jobless Claims.
Friday – Italy Balance of Trade (February).
Disclaimer
All financial data and/or economic information released by this Publication (the “Publication”); (the “Data” or the “Financial data
and/or economic information”), are provided for information purposes only,
without warranty of any kind, including without limitation the warranties of merchantability, fitness for a particular
purpose or warranties and non-infringement of any patent, intellectual property or proprietary rights of any party, and
are not intended for trading purposes. Banque Internationale à Luxembourg SA (the “Bank”) does not guarantee expressly or
impliedly, the sequence, accuracy, adequacy, legality, completeness, reliability, usefulness or timeless of any Data.
All Financial data and/or economic information provided may be delayed or may contain errors or be incomplete.
This disclaimer applies to both isolated and aggregate uses of the Data. All Data is provided on an “as is” basis. None of
the Financial data and/or economic information contained on this Publication constitutes a solicitation, offer, opinion, or
recommendation, a guarantee of results, nor a solicitation by the Bank of an offer to buy or sell any security, products and
services mentioned into it or to make investments. Moreover, none of the Financial data and/or economic information contained on
this Publication provides legal, tax accounting, financial or investment advice or services regarding the profitability or
suitability of any security or investment. This Publication has not been prepared with the aim to take an investor’s particular investment objectives,
financial position or needs into account. It is up to the investor himself to consider whether the Data contained herein this
Publication is appropriate to his needs, financial position and objectives or to seek professional independent advice before making
an investment decision based upon the Data. No investment decision whatsoever may result from solely reading this document. In order
to read and understand the Financial data and/or economic information included in this document, you will need to have knowledge and
experience of financial markets. If this is not the case, please contact your relationship manager. This Publication is prepared by
the Bank and is based on data available to the public and upon information from sources believed to be reliable and accurate, taken from
stock exchanges and third parties. The Bank, including its parent,- subsidiary or affiliate entities, agents, directors, officers,
employees, representatives or suppliers, shall not, directly or indirectly, be liable, in any way, for any: inaccuracies or errors
in or omissions from the Financial data and/or economic information, including but not limited to financial data regardless of the
cause of such or for any investment decision made, action taken, or action not taken of whatever nature in reliance upon any Data
provided herein, nor for any loss or damage, direct or indirect, special or consequential, arising from any use of this Publication
or of its content. This Publication is only valid at the moment of its editing, unless otherwise specified. All Financial data and/or
economic information contained herein can also quickly become out-of- date. All Data is subject to change without notice and may not be
incorporated in any new version of this Publication. The Bank has no obligation to update this Publication upon the availability of new data,
the occurrence of new events and/or other evolutions. Before making an investment decision, the investor must read carefully the terms and
conditions of the documentation relating to the specific products or services. Past performance is no guarantee of future performance.
Products or services described in this Publication may not be available in all countries and may be subject to restrictions in some persons
or in some countries. No part of this Publication may be reproduced, distributed, modified, linked to or used for any public or commercial
purpose without the prior written consent of the Bank. In any case, all Financial data and/or economic information provided on this Publication
are not intended for use by, or distribution to, any person or entity in any jurisdiction or country where such use or distribution would be
contrary to law and/or regulation. If you have obtained this Publication from a source other than the Bank website, be aware that electronic
documentation can be altered subsequent to original distribution.
As economic conditions are subject to change, the information and opinions presented in this outlook are current only as of the date
indicated in the matrix or the publication date. This publication is based on data available to the public and upon information that is
considered as reliable. Even if particular attention has been paid to its content, no guarantee, warranty or representation is given to the
accuracy or completeness thereof. Banque Internationale à Luxembourg cannot be held liable or responsible with respect to the information
expressed herein. This document has been prepared only for information purposes and does not constitute an offer or invitation to make investments.
It is up to investors themselves to consider whether the information contained herein is appropriate to their needs and objectives or to seek advice
before making an investment decision based upon this information. Banque Internationale à Luxembourg accepts no liability whatsoever for any investment
decisions of whatever nature by the user of this publication, which are in any way based on this publication, nor for any loss or damage arising
from any use of this publication or its content. This publication, prepared by Banque Internationale à Luxembourg (BIL), may not be copied or
duplicated in any form whatsoever or redistributed without the prior written consent of BIL 69, route d’Esch ı L-2953 Luxembourg ı
RCS Luxembourg B-6307 ı Tel. +352 4590 6699 ı www.bil.com.
Read more